National Vineyard Scan delivers first ever clear picture of Australia’s vineyards
For the first time, Australia’s grape and wine sector knows with a high degree of accuracy not only that it has 146,128 hectares under vine, but also the locations of the plantings, following the completion of the first National Vineyard Scan, funded by Wine Australia.
The National Vineyard Scan, conducted by Consilium Technology on behalf of Wine Australia, uses artificial intelligence and satellite imagery to provide highly accurate vineyard data – replacing the old Australian Bureau of Statistics paper-based sector survey, last published in 2015.
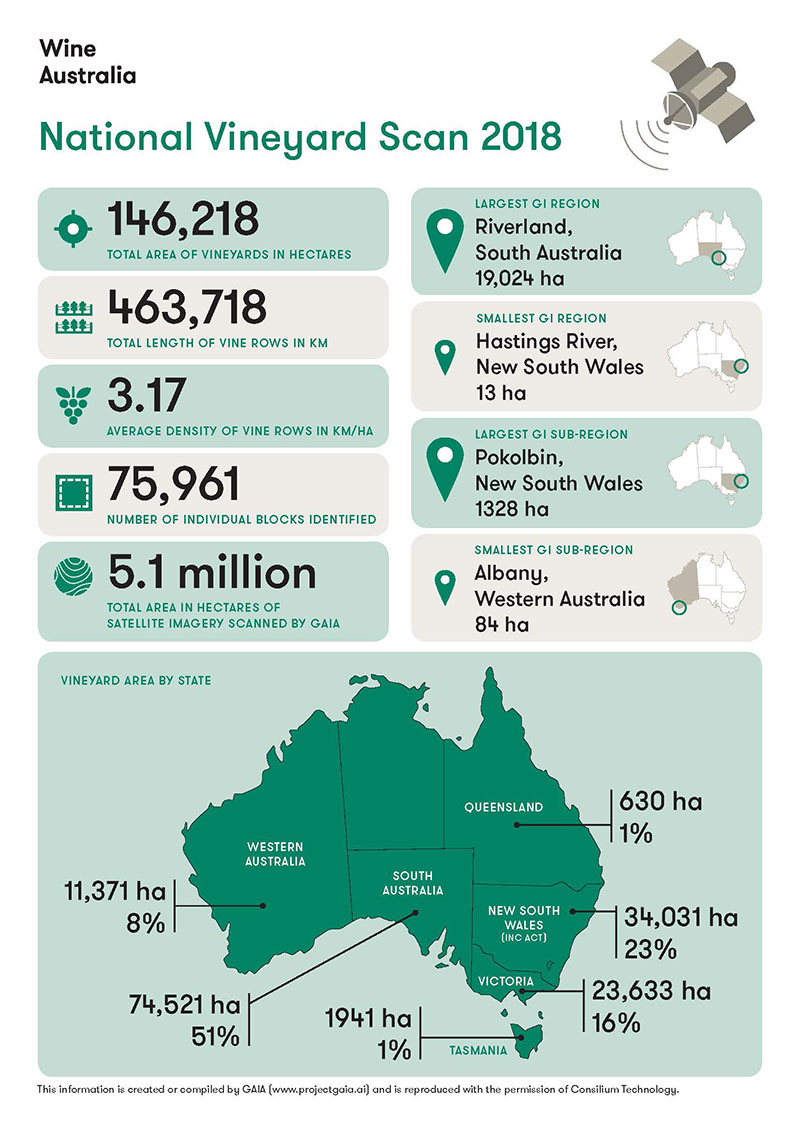
In its first-ever scan – which covered 5 million hectares – the technology revealed:
• the total area of vineyards (146,128 hectares)
• the total length of vine rows (463,718 kilometres – enough to wrap around the Earth 11 times)
• the average density of vine rows (3.17 kilometres/hectare)
• the number of individual blocks identified (75,961)
• the largest geographic identification (GI) region (Riverland, South Australia), and
• the smallest GI region (Hastings River, New South Wales).
Wine Australia Chief Executive Officer, Andreas Clark, said the National Vineyard Scan was very accurate, with 95 per cent matching of vineyards compared with human identifications in test samples.
“This scan provides the sector with a very good baseline for follow-up surveys that will be carried out over the next two years.
“The last ABS survey set the total reported area of vineyards at 135,133 hectares, about 8 per cent less than the Vineyard Scan found, but because of the differences in the methods used it is unwise to assign all of that difference to growth in plantings – some of that difference is likely to be the difference between estimated returns in the survey and actual mapping’, he said.
Mr Clark said the results of the scan and the comparison with the old survey did support anecdotal reports that there had been little change in the overall national vineyard over the past few years.
“If all of the difference between the two figures were to be taken into account, it would suggest growth of 11,000 hectares nationally in 3 years or about 4 per cent average annual growth per year, which aligns with anecdotal reports of only very moderate increases in plantings over that time frame.”
The results of the vineyard scan go much further than an overall vineyard area figure.
The locations of all the vineyard blocks detected have been mapped, providing information that can be used for emergency biosecurity responses. The new method has also measured vine row length, making it possible to assess planting densities by GI region and sub-region for the first time.
Also, for the first time, the vineyard area within each GI sub-region is known. For example, in New South Wales’ Hunter region, more than half (53 per cent) of vineyards fall within the Pokolbin GI sub-region, with 19 per cent in Broke Fordwich and 18 per cent in the Upper Hunter Valley.
The largest changes, compared with the 2015 ABS vineyard survey, were in the Barossa Valley (up by 1560 ha), the SA Riverland (up by 2034 ha) and Margaret River (up by 966 ha). The only regions to show significant decreases were the Riverina (down by 2112 ha) and Murray Darling Victoria (down 942 ha).
Consilium technology used an analysis algorithm known as Geospatial Artificial Intelligence for Agriculture (the acronym GAIA is also the name of the ancient Greek earth mother goddess). GAIA scans high-resolution satellite images of Australia’s wine regions to identify exactly where and how many vine rows are planted. GAIA will evolve over time and could ultimately be able to distinguish varieties in future.
In the short term, at the Australia Wine Industry Technical Conference at the end of July, an interactive GAIA app will be launched to allow grapegrowers and winemakers to identify and annotate their own blocks.
Full details on the vineyard scan are available here.
Acknowledgement: reproduced from a media release by Wine Australia